

Virtual Research Environment
Starting in 2020, the SeaDataNet infrastructure integrated a Virtual Research Environment (VRE) as part of the SeaDataCloud project. This initiative pioneered a pilot application that provided diverse services and research support utilising marine data and SeaDataNet tools such as WebODV and DIVA within the cloud environment. Access to the SeaDataCloud VRE required a Marine-ID for login authentication. Upon logging in, users gained entry to a personalized dashboard, granting access to a private workspace alongside various services.
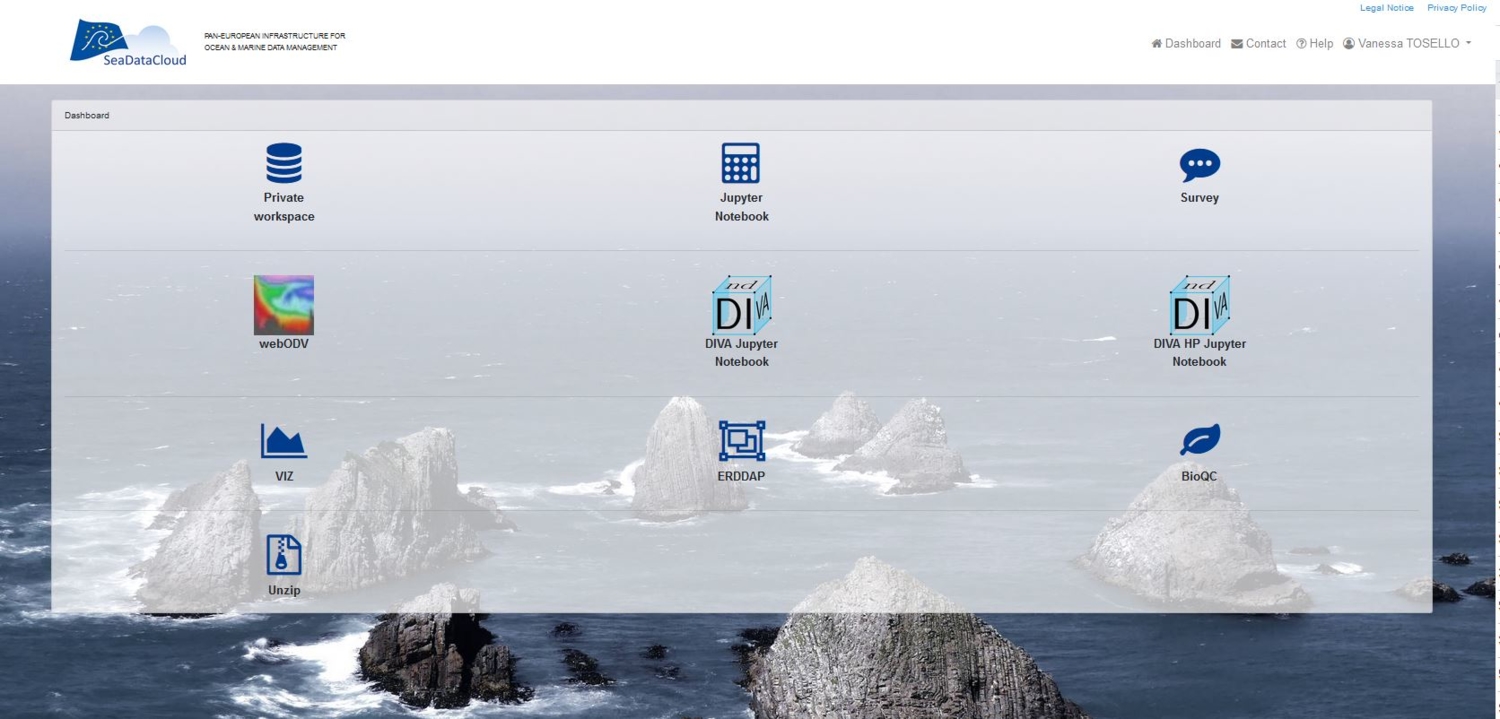
Overview of the tools available on the SeaDataCloud experimental VRE with a Jupyter notebook, webODV, DIVAnd, BioQ, VIZ, ERDDAP and more
See also all the presentations and videos from the webinar on 17/09/2020
Unfortunately since the VRE is no longer actively supported it is not accessible online. Below is a list of some of the current initiatives (non-exhaustive list subject to updating):
- D4Science infrastructure in connection with the BlueCloud 2026 project: https://blue-cloud.d4science.org/explore ; See also https://data.blue-cloud.org/ for data discovery and access services. In BC 2026, an update will be provided, including better data access from VRE platforms
- FAIR-EASE project: https://fairease.eu/ (Galaxy Earth System is connected with the FAIR-EASE project : https://earth-system.usegalaxy.eu)
- for webODV : https://webodv.awi.de (distributed system)
The data and main functionalities of the former SeaDataNet VRE are now available here:
- https://webodv-egi-ace.cloud.ba.infn.it (SDN T/S collections)
- https://hifis.webodv.cloud.awi.de (upload own data to webODV)
- for EMODnet Chemistry (data): https://emodnet-chemistry.webodv.awi.de
- M-VRE project with a Jupyter hub that includes DIVA software specific implementation for an Arctic dataset as part of the MOSAiC project, but it is a full version of DIVA and the ability to download your own data and write scripts, etc: https://mvre.diva.cloud.awi.de
- For BioQC and ERDDAP: Prototypes exists but have not yet been finalised for production.


